In this article, we will define and discuss how to calculate variance in excel. We can define variance as a measure of how far each value in the data set is from the mean. Standard deviation and variance are almost the same, their only difference is that, standard deviation is the square root of variance.
Formula to Calculate Variance in Excel.
Just like the others, the variance function is also available in excel.
| Name | Data Set | Text and Logical |
| VAR | Sample | Ignored |
| VARP | Population | Ignored |
| VAR.S | Sample | Ignored |
| VAR.P | Population | Ignored |
| VARPA | Population | Evaluated |
| VARA | Sample | Evaluated |
There are several types of variance functions in excel, but the type of question you have dictates the one you will use.
Example:
Suppose you are asked to find the variance of the ages of the people given below.
| Name | Age |
| Hiram | 50 |
| Hermione | 48 |
| Jug head | 27 |
| Polly | 28 |
| Andrew | 52 |
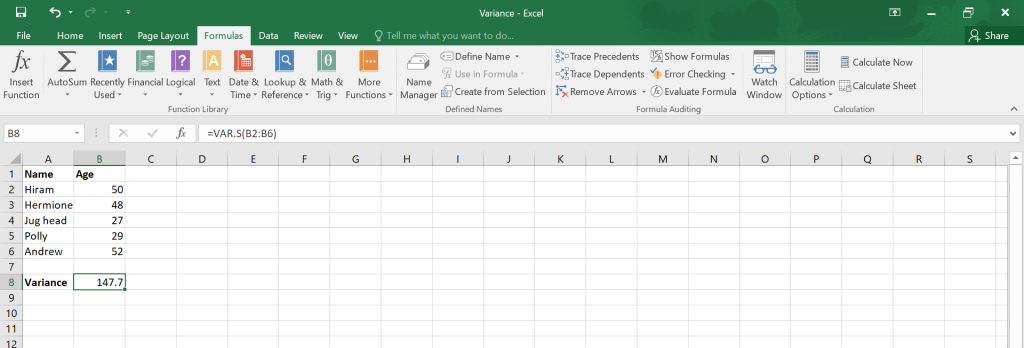
We begin by transferring the data to an excel spreadsheet.

We will use VAR.S variance function to calculate the variance. So after adding another row labelled as variance, we will type the function under the column labelled marks, type the numbers you want to find variance for then click enter and there goes your answer.

Therefore, your variance is 147.7.

