Covariance measures the directional relationship between the return on two assets.
Covariance is used in portfolio theory to determine what assets to include in the portfolio.
Formula to calculate covariance in excel.
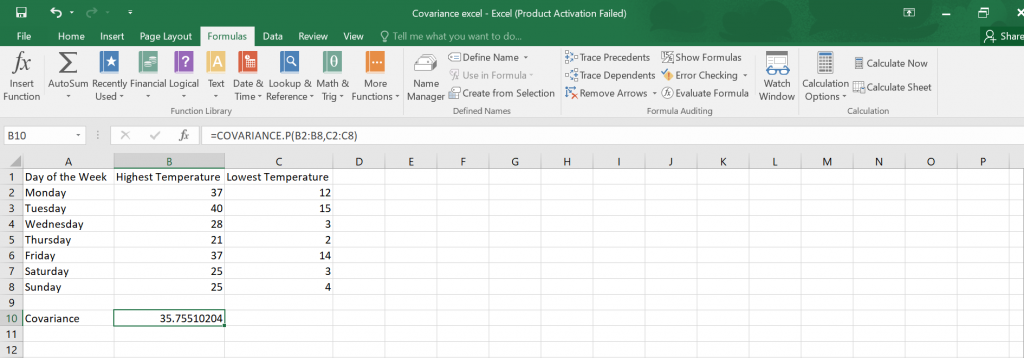
To calculate covariance in excel, we use the COVARIANCE Function.
There are two covariance functions;
i). COVARIANCE.P – Used to calculate population covariance.
ii). COVARIANCE.S – Used to calculate sample covariance.
Example:
Calculate the covariance of the following data set.
| Day of the Week | Highest Temperature | Lowest Temperature |
| Monday | 37 | 12 |
| Tuesday | 40 | 15 |
| Wednesday | 28 | 3 |
| Thursday | 21 | 2 |
| Friday | 37 | 14 |
| Saturday | 25 | 3 |
| Sunday | 25 | 4 |
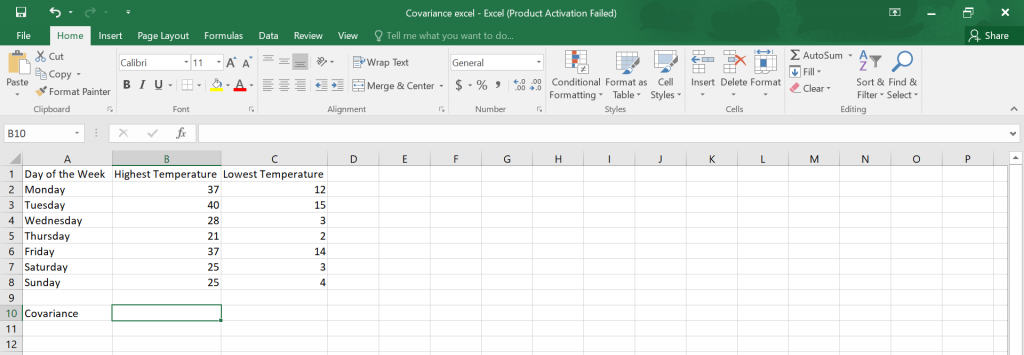
We begin by transferring the data onto an excel worksheet.

Fill the function argument sector and get your answer.

Therefore, your covariance is 35.75510204.

