P-value is the probability that a random chance generated the data or something else that is equal or rarer.
The t-value measures the size of the difference relative to the variation in your sample data.
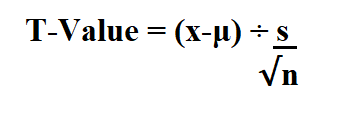
Formula to calculate P value from T.
- State the null and alternative hypotheses.
- Find the test statistic.
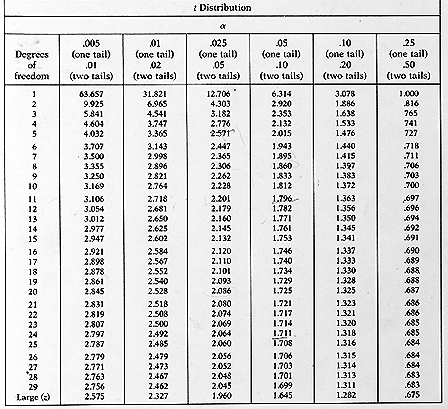
- Find the p-value for the test statistic by using the t-Distribution table with n-1 degrees of freedom. .
Example:
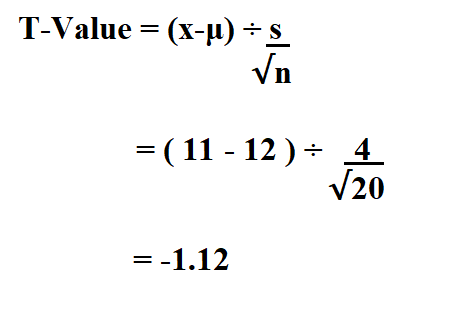
Chris wants to know if the mean height of a certain species of plant is equal to 12 inches, he collected a random sample of 20 plants and found that the sample mean is 11 inches and the sample standard deviation is 4 inches. Conduct a t-test using a 0.05 alpha level to determine if the true mean height for the population is actually 12 inches.
We begin by stating the null and alternative hypothesis.
H0: µ = 12
Ha: µ ≠ 12
Then find the test statistic using the formula below.

- x is the sample mean
- μ is the hypothesized mean.
- s is the sample standard deviation.
- n is the sample size.

Then finally, find the p-value for the test statistic by using the t-Distribution table with n-1 degrees of freedom.
= n – 1
= 20 – 1
= 19

In the t-table above, we need to look at the row that corresponds to 19 on the left-hand side and attempt to look for the absolute value of our test statistic -1.12.
It falls between the two values 0.688 and 1.328, the two alpha levels at the top are 0.25 and 0.10.
This means that the p-value for a one-sided test is between 0.25 and 0.10, which is 0.175. Since its a two sided test we multiply 0.175 by 2 to get 0.35.
Therefore, our estimated p-value is 0.35.

