Frequency measures the number of times something occurs.
You can use excel’s FREQUENCY function to create a frequency distribution table that shows the frequency of each value in a range.
Formula to calculate frequency in excel.
To calculate frequency in excel, you need to understand the following terms.
- data_array – is the whole data data set.
- bins_array – are the intervals whose frequency you want to know.
Example:
If you are asked to find the frequency of the 50, 60 and 70 in the following set of data.
| 36 |
| 52 |
| 23 |
| 61 |
| 55 |
| 59 |
| 78 |
| 19 |
| 23 |
| 75 |
| 69 |
| 61 |
| 23 |
| 61 |
| 53 |
| 23 |
| 54 |
| 56 |
| 23 |
| 67 |
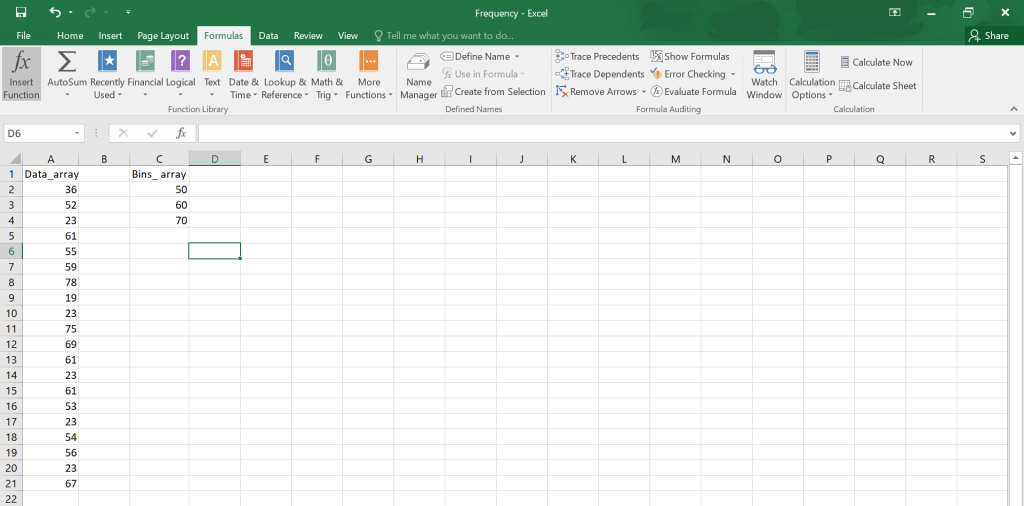
We will begin by transferring the set of data to an excel spreadsheet.

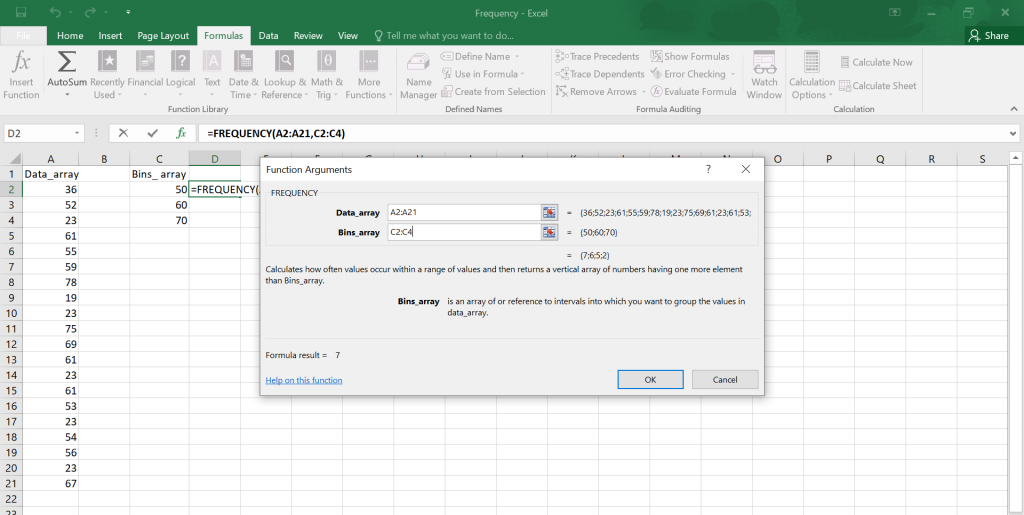
Then click on the frequency function and something like this should appear, where your supposed to fill in your data_array and bins_array.

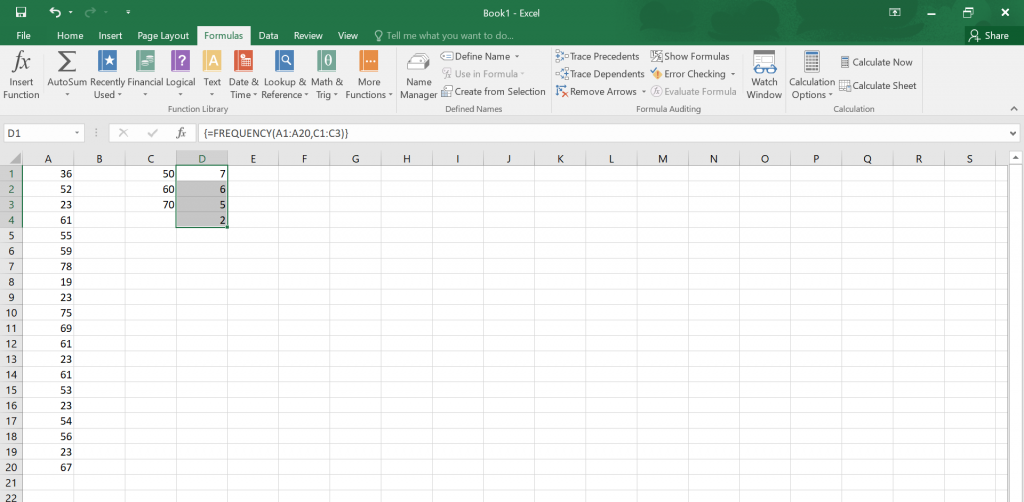
Click OK and drag the bottom right corner up to. Since this is an array function, for it to give you correct answers, you will have to click on the formula, then click ctrl+shift+enter and get your answers.


