In mathematics, the slope or gradient of a line is a number that describes both the direction and the steepness of the line.
Slope is calculated as rise divided by run.
Formula to calculate slope in excel.
To calculate slope in excel, we can use the x value and the y value which is the easy way, or use a scatter plot and and add trend line.
In our case, lets use the scatter plot and trend line method.
Example:
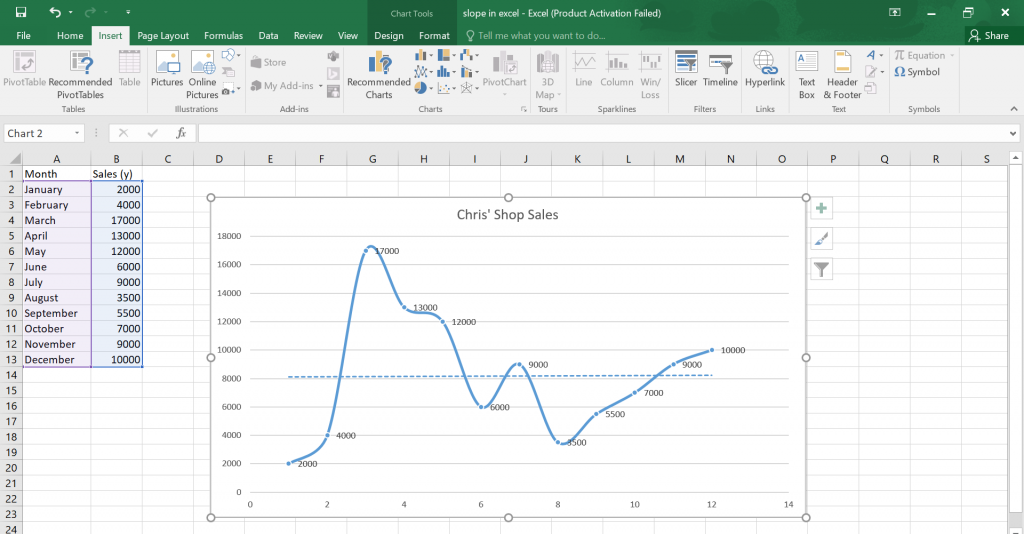
Suppose you are to use Chris’ shop data below to plot a scatter plot.
| Month (x) | Sales (y) |
| January | 2,000 |
| February | 4,000 |
| March | 17,000 |
| April | 13,000 |
| May | 12,000 |
| June | 6,000 |
| July | 9,000 |
| August | 3,500 |
| September | 5,500 |
| October | 7,000 |
| November | 9,000 |
| December | 10,000 |
We’ll begin by transferring the data to a worksheet, highlight your data, click on the chart section and select scatter plot.

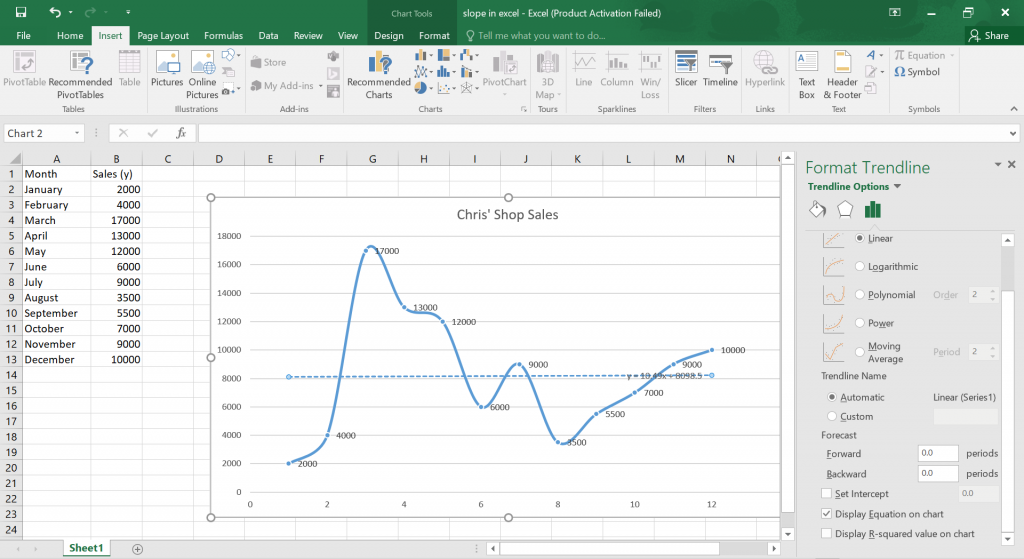
Then right click and click on add trend line, a new window will appear, click on display equation on chart, then close the window.

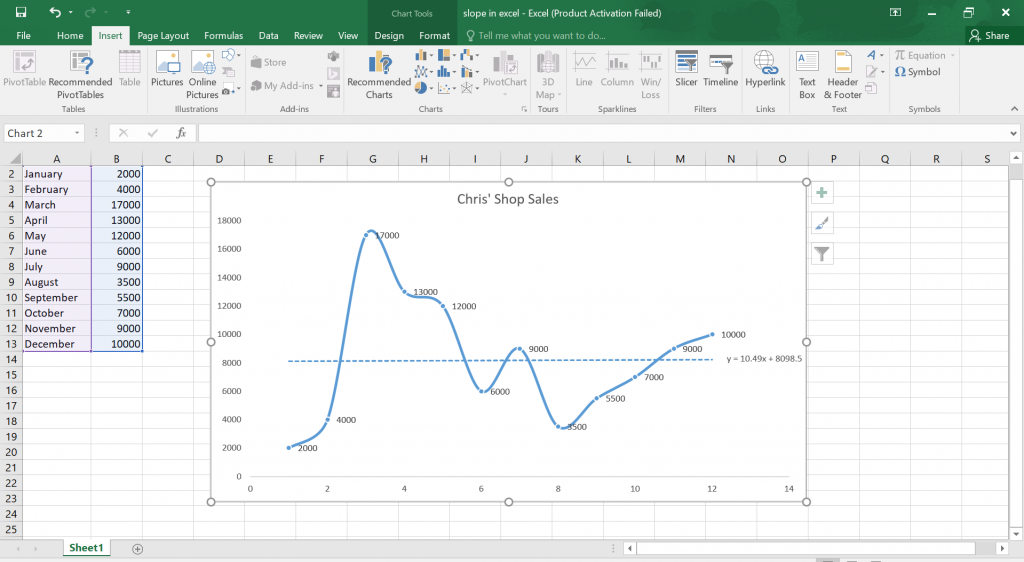
You should see your equation and be able to move it anywhere you want on your scatter plot.

Therefore, your equation is y = 10.49x + 8098.5, this insinuates that your slope or gradient is 10.49.

