Prior to discussing how to calculate confidence interval in excel, let us define it. We can define confidence interval as a measure of the degree of uncertainty or certainty in a sampling method.
To find the confidence interval, we use sample data that is, the sample mean and the sample size.
Formula to Calculate Confidence Interval in Excel.
The CONFIDENCE function is categorized under Excel Statistical functions. In excel there are two confidence interval functions and they are;
- The confidence interval for a normal distribution (=CONFIDENCE.NORM)
- Confidence interval when you are using the T’s distribution (=CONFIDENCE.T)
Benefits.
- It is time saving. You can save much time on computing complex data, as Excel does automatically, so long as you input the correct values.
- Microsoft excel is accessible.
Example:
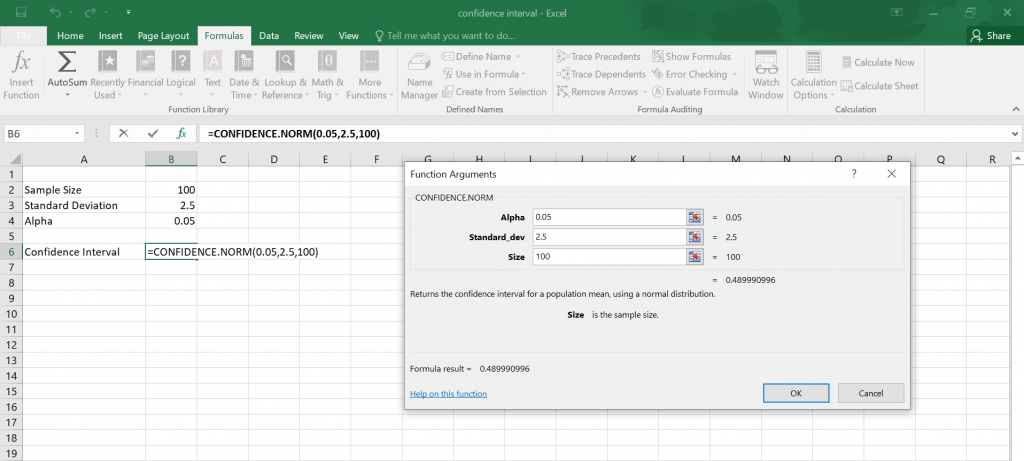
Suppose you are given a significance level or alpha 0.05 and the standard deviation of the population is 2.5 and your sample size is 100.
You will need to transfer the data to an excel spreadsheet, since the sample size is greater than 30, we will use CONFIDENCE.NORM and a table should appear where you will fill in your data as directed by excel.

Click OK and get your answer.

Therefore, your confidence interval is 0.489991.

