Prior to discussing how to calculate least squares regression line let us define what a regression line is. A regression line is a straight line that describes how a response variable y changes as an explanatory variable x changes.
Ordinary least squares regression is a way to find the line of best fit for a set of data.
Formula to Calculate Squares Regression Line.
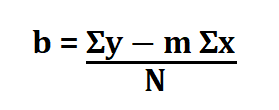
Since the line’s equation is y = mx + b, all we need to do is find the values of m (gradient) and b (y-intercept) using the following formulas.
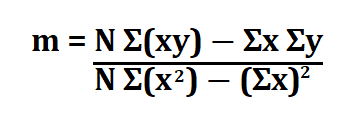
N is the number of points
x,y are the values on the x and y axis.
M is the gradient.
Example:
Suppose you found out how many hours of sunshine verse how many bottles of water were sold at the shop from Monday to Friday to be as follows;
| Hours of Sunshine (x) | Bottles of Water Sold (y) |
| 6 | 12 |
| 5 | 10 |
| 4 | 8 |
| 5 | 7 |
| 5 | 9 |
Therefore, we will begin by finding the value of m.
We first need to find;
N = 5
Σx^2 = 625
Σy = 46
Σxy = 234
Σx = 25
Therefore m is;
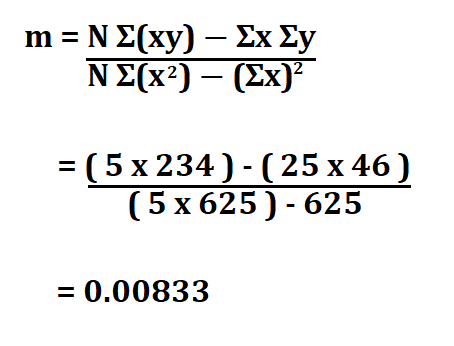
m = 0.00833
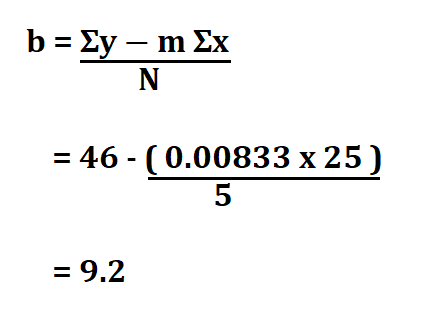
Therefore, the y-intercept is 9.2.
If y = mx + b
Then y = 0.00833x + 9.2

