In statistics, an outlier is a data point that differs significantly from other observations.
An outlier may be due to variability in the measurement or it may indicate experimental error.
Formula to calculate outlier.
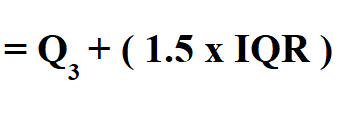
For the higher outlier we use the following formula.
For the lower outlier we use;
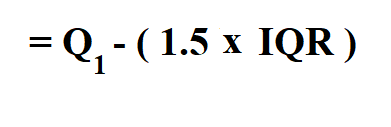
Q1 is the lower quartile.
Q3 is the upper quartile.
IQR is the interquartile range.
Example:
Suppose you had a data set and you calculated your lower quartile to be 5 and your upper quartile to be 60. If your interquartile range is 55, calculate your lower outliers.
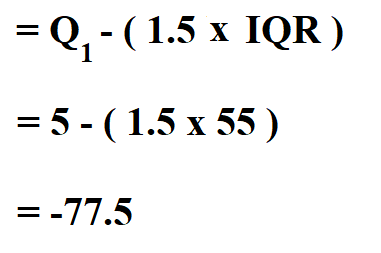
Therefore, your lower outlier is -77.5.

