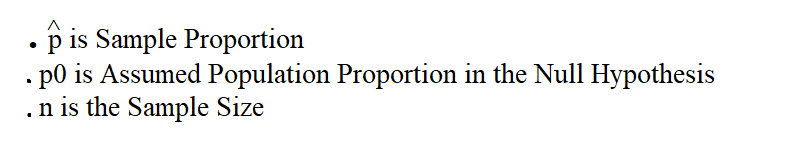
In statistics, the p-value is the probability of obtaining results at least as extreme as the observed results of a statistical hypothesis test, assuming that the null hypothesis is correct.
P-value helps you determine the significance of your results in relation to the null hypothesis.
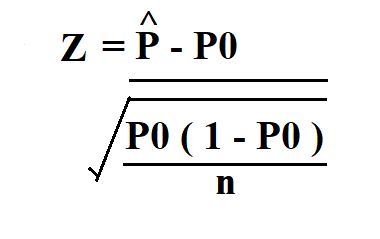
Formula to calculate p-value.
- We need to find out the test statistic z using the following diagram.
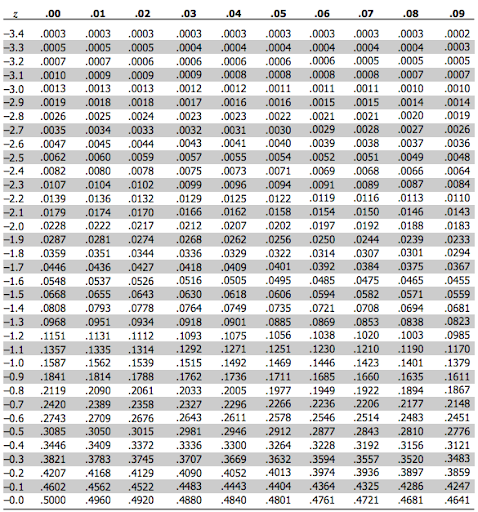
- Then find the corresponding level of p from the z value obtained from the z tables which can be found online.
Example:
Suppose you calculated your z value and found it to be 2.8, calculate your p-value.
Since the normal distribution is symmetric, negative values of z are equal to its positive values.
Therefore, 2.8 in the z column and the corresponding value of 0.00 we get p-value as 0.0026.

