T-statistic is the ratio of the departure of the estimated value of a parameter from its hypothesized value to its standard error.
The t-value measures the size of the difference relative to the variation in your sample data.
T-statistic is used when the sample size is less than 30 units or the population standard deviation is unknown.
Formula to calculate t-statistic.
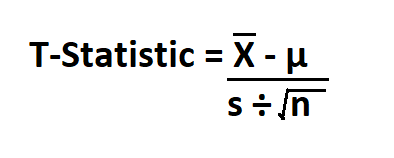
- X-bar is the sample mean.
- μ is the population mean.
- S is the sample standard deviation.
- n is the number of units in the sample.
Example:
If the population mean is 6 and the sample mean is 8, calculate the t-statistic if the standard deviation is 4 and the number of units in the sample is 16.
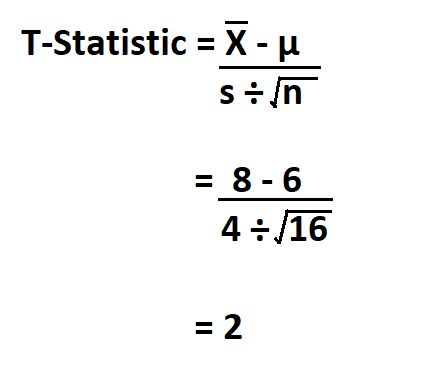
Therefore, your t-statistic is 2.

