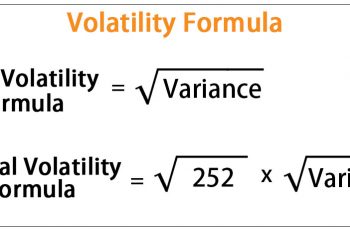
We can define variance as a measure of how far each value in the data set is from the mean. Standard deviation and variance are almost the same, their only difference is that, standard deviation is the square root of variance.
Formula to calculate variance of ungrouped data.
To calculate variance of ungrouped data;
- Find the mean of the (μ) numbers given.
- Subtract the mean from each of the numbers (x), square the difference and find their sum.
- Divide the result by the total number of observations (N).

Example:
Find the variance of the following numbers.
2, 3, 2, 2, 1
We start by finding the mean of the list of data.

Then subtract the mean from each of the numbers, square the difference and find their sum.

Divide the result by the total number of observations.
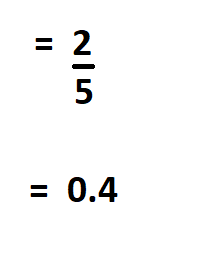
Therefore, the variance of the dataset is 0.4.
Formula to calculate variance of grouped data.

Example:
Find the variance of the following set of data.
| Class | Frequency (f) | Midpoint (m) |
| 1 – 10 | 8 | 5.5 |
| 11 – 20 | 12 | 15.5 |
| 21 – 30 | 16 | 25.5 |
We begin by finding the mean of the data.
| Class | Frequency (f) | Midpoint (m) | Product (m x f) |
| 1 – 10 | 8 | 5.5 | 44 |
| 11 – 20 | 12 | 15.5 | 186 |
| 21 – 30 | 16 | 25.5 | 408 |
| N = 36 | = 638 |
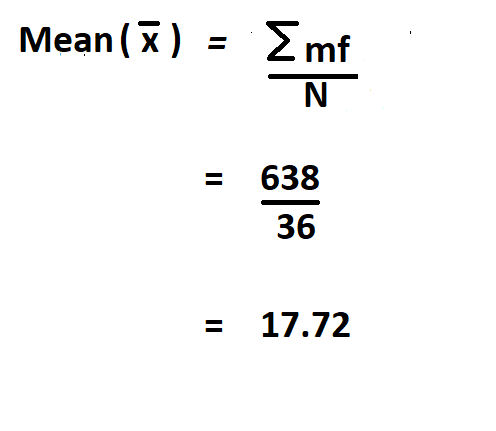
Then find the deviation of the midpoint from the mean, square it, multiply each by its frequency and put them together.
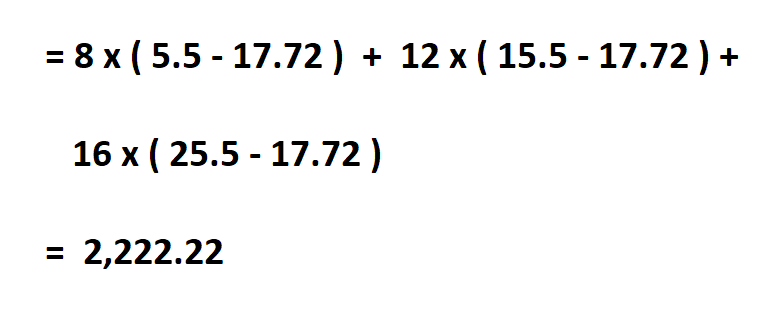
Then divide the result by N, which is the total number of observations.
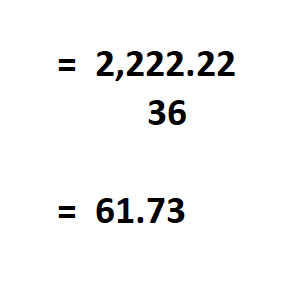
Therefore, the variance of the data is 61.73.
