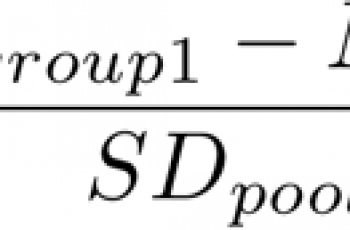
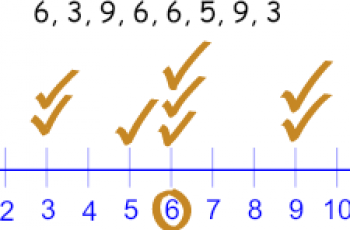
Standard deviation is a measure of how close the numbers are to the mean. It is calculated as the square root of the variance and denoted by σ (the Greek letter sigma).
Types of standard deviation formulas in excel.
There are more than five types of standard deviation formulas that you can use in excel. It all depends on what the question requires.
Lets us look at those types first.
- STDEV.S, STDEVA, and STDEV, these ones are used to calculate the sample standard deviation.
- STDEV.P, STDEVPA, and STDEVP are used to calculate the standard deviation for an entire population.
- STDEV.S. is used when data is numeric, which means that it will ignore text and logical values.
- STDEVA. is used when text and logical values are included in the calculation along with numbers. Text and FALSE are read as 0, and TRUE is understood as 1.
- STDEV. This formula is compatible with older versions of Excel (2007 or prior) but completes the same function as STDEV.S.
Example:
Calculate the standard deviation of the age of the following people.
| Name | Age |
| Mike | 12 |
| Margret | 14 |
| Susan | 12 |
| Evangeline | 13 |
| Stephen | 14 |
| Steve | 11 |
| Ann | 15 |
| Alice | 13 |
To calculate the standard deviation, we first transfer our data to an excel spreadsheet and add a standard deviation’s column.
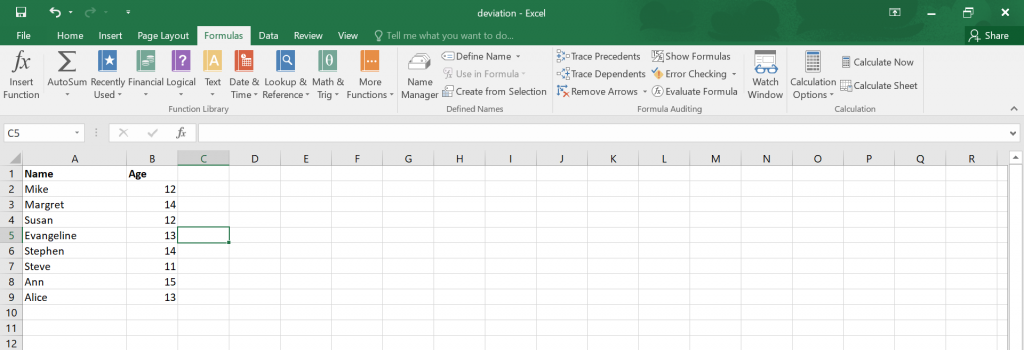
We will use STDEV.S. to calculate the standard deviation.
When you add another row written standard deviation and type the formula, it should appear like below, where you will type the numbers you want to calculate standard deviation for.
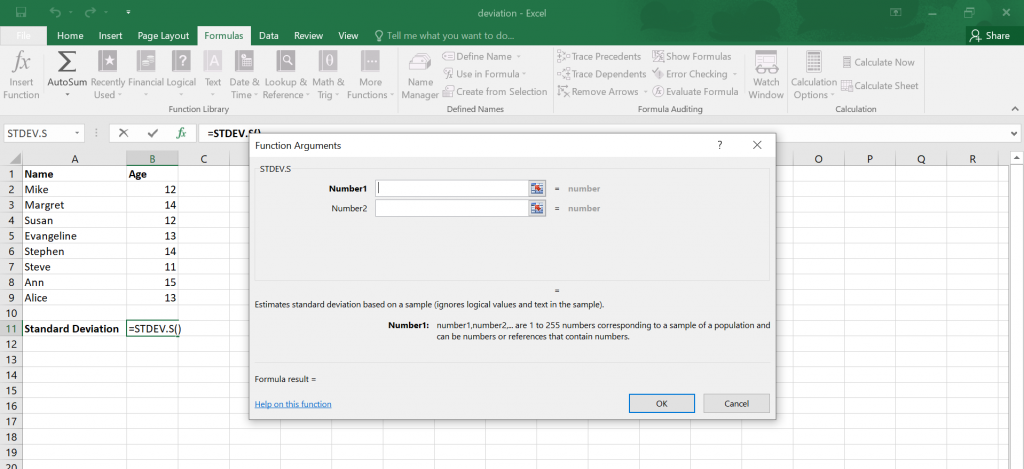
Then you will get your answer after clicking enter.
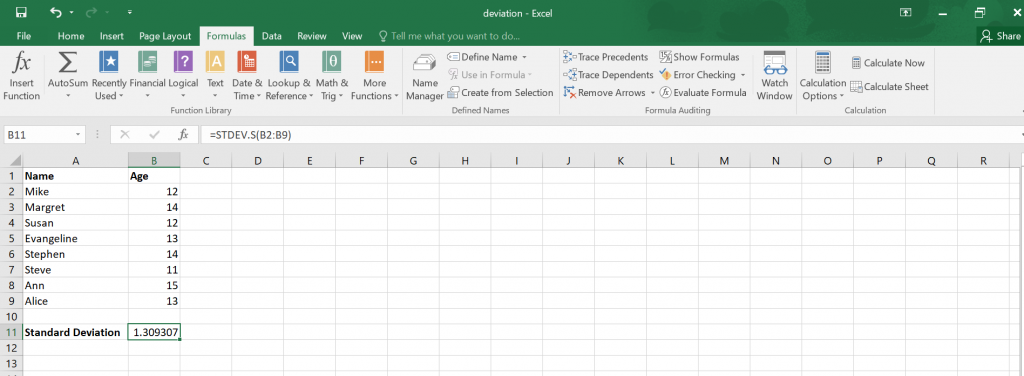
Therefore, the standard deviation for your data is 1.309307.
